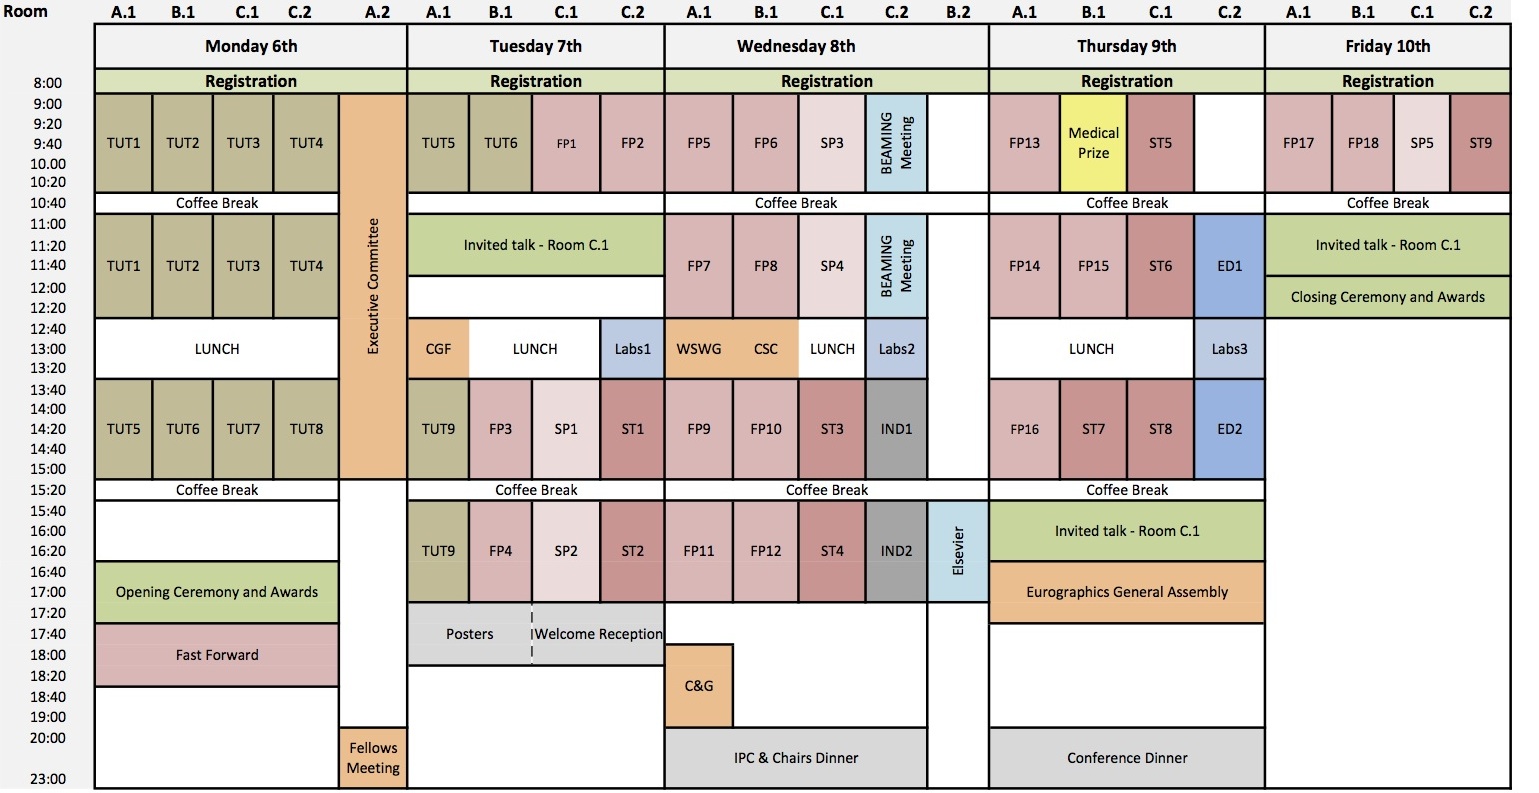
Tutorial Track
Tut1: Data-Driven Simulation Methods in Computer Graphics: Cloth, Tissue and Faces
- Monday, May 6th, 9:00-12:40 (Half Day) in Room A.1
- Miguel A. Otaduy, URJC Madrid
Bernd Bickel, Disney Research Zurich
Derek Bradley, Disney Research Zurich
- Abstract: In recent years, the field of computer animation has witnessed the invention of multiple simulation methods that exploit pre-recorded data to improve the performance and/or realism of dynamic deformations. Various methods have been presented concurrently, and they present differences, but also similarities, that have not yet been analyzed or discussed. This tutorial focuses on the application of data-driven methods to three areas of computer animation, namely dynamic deformation of faces, soft volumetric tissue, and cloth. The tutorial describes the particular challenges tackled in a data-driven manner, classifies the various methods, and also shares insights for the application to other settings.
The explosion of data-driven animation methods and the success of their results make this tutorial extremely timely. Up till now, the proposed methods have remained familiar only at the research context, and have not made their way through computer graphics industry. This tutorial aims to fit two main purposes. First, present a common theory and understanding of data-driven methods for dynamic deformations that may inspire the development of novel solutions, and second, bridge the gap with industry, by making data-driven approaches accessible. The tutorial targets an audience consisting of both researchers and programmers in computer animation.
Tut2: Video Visualization
- Monday, May 6th, 9:00-12:40 (Half Day) in Room B.1
- M. Chen, University of Oxford
D. Weiskopf, University of Stuttgart
R. Borgo, Swansea University
M. Höferlin, University of Stuttgart
K. Kurzhals, University of Stuttgart
P. Legg, Swansea University
R. Netzel, University of Stuttgart
S.Walton, University of Oxford
- Abstract:
Video visualization is concerned with the creation of a new visual representation from an input video to reveal important features and events in the video. It typically extracts meaningful information from a video and conveys the extracted information to users in abstract or summary visual representations. Video visualization is not intended to provide fully automatic solutions to the problem of making decisions about the contents of a video. Instead, it aims at offering a tool to assist users in their intelligent reasoning while removing the burden of viewing videos. In particular, it can be used to fill in many gaps in practice where automated computer vision is yet to provide usable solutions. This aim justifies deviation from the creation of realistic imagery, and allows simplifications and embellishments, to improve the understanding of the input video.
Video data is inherently a form of volumetric data, and it also exhibits some flow‐like features, such as motion flows. There have been many tutorials on the advances in volume visualization since 1980s, and those in flow visualization since 1990s. Despite that video data is more abundant and ubiquitous than medical imaging data, or flow simulation data, there has not been any educational programs on video visualization. This is rather incompatible with the fact that the rapid advance of digital recording and creation technologies has resulted in an explosion of video data. As visual search through videos is time consuming, often tedious, and mostly involves watching videos repeatedly, there is a real urgency to engage more researchers in developing new techniques for visualizing videos.
The development of video visualization started in early 2000s, which saw the emergence of a collection of novel visual designs that allow viewers to gain an insight about a video rapidly, usually without the need for watching the video. Recently, visual analytics techniques have been applied to the process of video analysis, ranging from interactive exploration to interactive construction of classifiers. The use of video visualization has also been extended from security and entertainment applications to sports and biomedical applications.
Tut3: Understanding and Designing Perceptual Experiments
- Monday, May 6th, 9:00-12:40 (Half Day) in Room C.1
- D. Cunningham, Brandenburg Technical University
C. Wallraven, Korea University
- Abstract:
Humans and computer both have limited resources with which they must process the massive amount of information present in the natural world. For over 150 years, physiologists and psychologists have been performing experiments to elucidate what information humans and animals can detect as well as how they extract, represent and process that information. Recently, there has been an increasing trend of computer scientists performing similar experiments, although often with quite different goals. This tutorial will provide a basic background on the design and execution of perceptual experiments for the practicing computer scientist.
Tut4: Computational Displays
- Monday, May 6th, 9:00-12:40 (Half Day) in Room C.2
- G. Wetzstein, MIT Media Lab
D. Lanman, Nvidia Research
P.Didyk, MIT CSAIL
- Abstract:
With the invention of integral imaging and parallax barriers in the beginning of the 20th century, glasses-free 3D displays have become feasible. Only today —more than a century later— glasses-free 3D displays are finally emerging in the consumer market. The technologies being employed in current-generation devices, however, are fundamentally the same as what was invented 100 years ago. With rapid advances in optical fabrication, digital processing power, and computational models for human perception, a new generation of display technology is emerging: computational displays exploring the co-design of optical elements and computational processing while taking particular characteristics of the human visual system into account. This technology does not only encompass 3D displays, but also next-generation projection systems, high dynamic range displays, perceptually-driven devices, and computational probes.
This tutorial serves as an introduction to the emerging field of computational displays. The pedagogical goal of this tutorial is to provide the audience with the tools necessary to expand their research endeavors by providing step-by-step instructions on all aspects of computational displays: display optics, mathematical analysis, efficient computational processing, computational perception, and, most importantly, the effective combination of all these aspects. Specifically, we will discuss a wide variety of different applications and hardware setups of computational displays, including high dynamic range displays, advanced projection systems as well as glasses-free 3D display. The latter example, computational light field displays, will be discussed in detail. In the tutorial presentation, supplementary notes, and an accompanying website, we will provide source code that drives various display incarnations at real-time framerates, detailed instructions on how to fabricate novel displays from off-the-shelf components, and intuitive mathematical analyses that will make it easy for researchers with various backgrounds to get started in the emerging field of computational displays. We believe that computational display technology is one of the “hottest” topics in the graphics community today; with this tutorial we will make it accessible for a diverse audience.
We will discuss all aspects of computational displays in detail. Specifically, we begin by introducing the concept and discussing a variety of example displays that exploit the joint-design of optical components and computational processing for applications such as high dynamic range image and wide color gamut display, extended depth of field projection, and high-dimensional information display for computer vision applications. We will then proceed to discussing state-of-the-art computational light field displays in detail. In particular, we will focus on how high-speed displays, multiple stacked LCDs, and directional backlighting combined with advanced mathematical analysis and efficient computational processing provide the foundations of 3D displays of the future. Finally, we will review psycho-physiological aspects that are of importance for display design and demonstrate how perceptually-driven computational displays can enhance the capability of current technology.
Tut5: An Eye on Perceptual Graphics: Eye-Tracking Methodology
- Monday, May 6th, 13:40-15:20 and Tuesday, May 7th, 9:00-10:40 (Half Day) in Room A.1
- A. T. Duchowski, Clemson University
K. Krejtz, Warsaw Information Processing Institute
I. Krejtz, Warsaw University of Social Sciences and Humanities
R. Mantiuk, West Pomeranian University of Technology
B. Bazyluk, West Pomeranian University of Technology
- Abstract:
Eye-tracking technology has evolved considerably over the last decade. The tutorial provides attendees with stateof-the-art advancements and their relevance to computer graphics research, one of the most important being the proliferation of Do-It-Yourself (DIY) techniques. Following a summary of how to build your own, we will cover real-time graphics applications, including advancements in gaze-contingent displays. The second half of the tutorial will focus on offline, diagnostic graphics applications, where gaze is used to evaluate visual aspects of rendered scenes. We will present a methodological “pipeline” that we have evolved and adapted to various experiments. The tutorial differs from previous ones by largely ignoring aspects of human vision and focusing on technical details that are most pertinent to the EuroGraphics audience.
Tut6: Tensor Approximation in Visualization and Graphics
- Monday, May 6th, 13:40-15:20 and Tuesday, May 7th, 9:00-10:40 (Half Day) in Room B.1
- R. Pajarola, University of Zurich
S. K. Suter, University of Zurich
R. Ruiters, University of Bonn
- Abstract:
In this course, we will introduce the basic concepts of tensor approximation (TA) – a higher-order generalization of the SVD and PCA methods – as well as its applications to visual data representation, analysis and visualization, and bring the TA framework closer to visualization and computer graphics researchers and practitioners. The course will cover the theoretical background of TA methods, their properties and how to compute them, as well as practical applications of TA methods in visualization and computer graphics contexts. In a first theoretical part, the attendees will be instructed on the necessary mathematical background of TA methods to learn the basics skills of using and applying these new tools in the context of the representation of large multidimensional visual data. Specific and very noteworthy features of the TA framework are highlighted which can effectively be exploited for spatio-temporal multidimensional data representation and visualization purposes. In two application oriented sessions, compact TA data representation in scientific visualization and computer graphics as well as decomposition and reconstruction algorithms will be demonstrated. At the end of the course, the participants will have a good basic knowledge of TA methods along with a practical understanding of its potential application in visualization and graphics related projects.
Tut7: Projective geometry, duality and precision of computation in computer graphics, visualization and games
- Monday, May 6th, 13:40-15:20 (Quarter Day) in Room C.1
- V. Skala, University of West Bohemia
- Abstract:
Homogeneous coordinates and projective geometry are mostly connected with geometric transformations only. However the projective extension of the Euclidean system allows reformulation of geometrical problems which can be easily solved. In many cases quite complicated formulae are becoming simple from the geometrical and computational point of view. In addition they lead to simple parallelization and to matrix-vector operations which are convenient for matrix-vector hardware architecture like GPU.
In this short tutorial we will introduce "practical theory" of the projective space and homogeneous coordinates. We will show that a solution of linear system of equations is equivalent to generalized cross product and how this influences basic geometrical algorithms. The projective formulation is also convenient for computation of barycentric coordinates, as it is actually one cross-product implemented as one clock instruction on GPU. Additional speed up can be expected, too.
Moreover use of projective representation enables to postpone division operations in many geometrical problems, which increases robustness and stability of algorithms. There is no need to convert coordinates of points from the homogeneous coordinates to the Euclidean ones as the projective formulation supports homogeneous coordinates natively.
The presented approach can be applied in computational problems, games and visualization applications as well.
Tut8: Natural Image Statistics: Foundations and Applications
- Monday, May 6th, 13:40-15:20 (Quarter Day) in Room C.2
- T. Pouli, MPI Informatik
D. Cunningham, Brandenburg Technical University
E. Reinhard, MPI Informatik
- Abstract:
Natural images exhibit statistical regularities that differentiate them from random collections of pixels. Moreover, the human visual system appears to have evolved to exploit such statistical regularities. As computer graphics is concerned with producing imagery for observation by humans, it would be prudent to understand which statistical regularities occur in nature, so they can be emulated by image synthesis methods. In this tutorial we introduce all aspects of natural image statistics, ranging from data collection to analysis and finally their applications in computer graphics, computational photography, image processing and art.
Tut9: Symmetry in Shapes – Theory and Practice
- Tuesday, May 7th, 13:40-17:20 (Half Day) in Room A.1
- N. Mitra, UCL London
M. Ovsjanikov, Ecole Polytechnique
M. Pauli, EPFL
M. Wand, MPI Informatik
- Abstract:
This tutorial addresses symmetry in shapes. Our goal is to introduce the audience to the notion of symmetry in shapes and familiarize them with the formal models as well as the algorithmic tools for detecting, describing, and utilizing symmetry in shapes. Our tutorial is built on the idea of switching back and forth between the abstract mathematical models, which concisely capture the structure of the problem and let us reason about its consequences, and proven practical, algorithmic tools, which permit us to implement and utilize the presented ideas.
On the theory side, we will in particular discuss the group theoretical foundations of symmetries in shapes, and apply the theory to different scenarios of global and partial symmetry, as well as to different notions of transformation groups characterizing extrinsic and intrinsic notions of symmetry. On the practical side, we will explain the two most important approaches to efficient symmetry detection: voting methods and local feature-matching techniques. Further, we will explain the main ideas on how regularity can be detected from pairwise correspondence information, and discuss recent ideas for making symmetry detection scalable for large geometric data sets.
Our tutorial will conclude with a summary of open problems and a discussion of possible future impact of symmetry-based models in computer graphics and vision.